Multidimensional Poverty Index (MPI) is an index that measures countries’ dimensions of poverty using some indicators. Countries are weighed based on these indicators. The values of these indicators are then calculated to get an index that ranges from 0 to 1. Lower MPI values represent a better performance regarding multidimensional poverty.
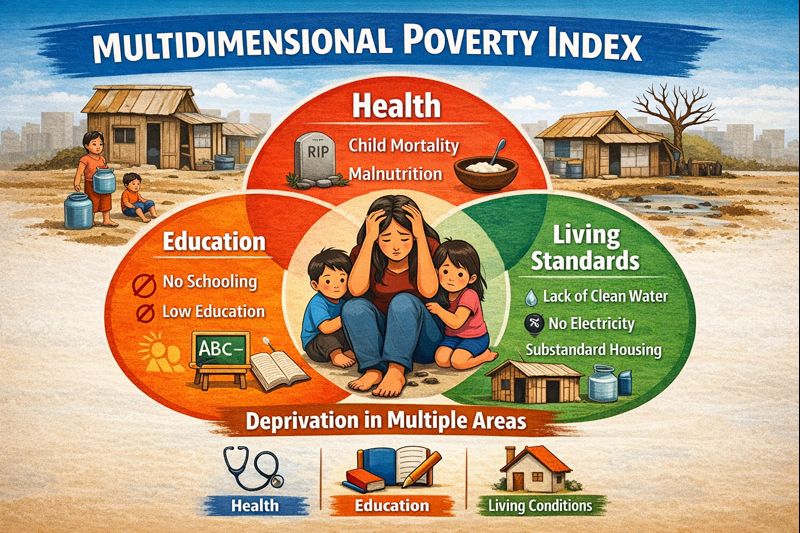
The global MPI measures acute multidimensional poverty across more than 100 developing countries. It does so by measuring each person’s overlapping deprivations across 10 indicators in three equally weighted dimensions: health, education and standard of living.
Multidimensional Poverty Index (MPI) Indicators
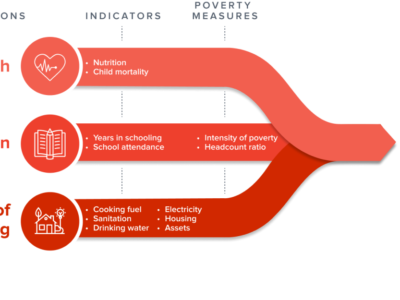
The dimensions of poverty are as follows
- Health: dimension of poverty is measured using indicators such as nutrition and child mortality. Each taking one-sixth of the MPI’s weight for a total of one-third.
- Education: dimension of poverty is measured using indicators such as years of schooling and school attendance. Each taking one-sixth of the MPI’s weight for a total of one-third.
- Standard of Living: dimension of poverty is measured using indicators such as cooking fuel, sanitation, drinking water, electricity, housing and assets. Each taking one-eighteenth of the MPI’s weight for a total of one-third.
Each dimension of poverty contributes one-third of the MPI’s weight.
Top 3 African Countries
Classifying the top 3 African countries depend on the metric being used. For the purpose of the MPI, we would use the metrics such as follows.
- Population
- Economic Power (i.e., GDP)
- Economic Power/development
Based these metrics, Nigeria, South Africa, and Egypt are the top 3 African countries. Nigeria rank highest for population. South Africa for economic power (GDP), and Egypt for economic power/development. These three countries — Nigeria, Egypt, and South Africa — are consistently recognized as major players across various rankings due to their large populations, significant economies, and regional influence.
Although, the top 3 African countries by population are Nigeria, Ethiopia, Egypt). Top 3 African countries by economic power are Nigeria, South Africa, and Egypt. Top 3 African countries by economic/power development are Egypt, South Africa, and Morocco.
Top 3 African Countries based on 2025’s MP Index
The table below compares the top 3 countries in Africa based on the MPI indicators.
| Nigeria | South Africa | Egypt | |
|---|---|---|---|
| Nutrition | no data | 31.1% | 33.1% |
| Child mortality | 19.5% | 8.3% | 6.9% |
| Years of schooling | 15.9% | 10.5% | 24.3% |
| School attendance | 19.7% | 2.6% | 28.8% |
| Cooking fuel | 10.1% | 9.9% | no data |
| Sanitation | 8.4% | 4.6% | 2.4% |
| Drinking water | 5.8% | 8.5% | 1.1% |
| Electricity | 7.9% | 7.9% | 0.2% |
| Housing | 7.8% | 9.3% | 2.5% |
| Assets | 4.9% | 7.2% | 0.7% |
These percentages indicate how much each indicator contributes to the overall multidimensional poverty index. The higher the percentage, the higher the indicator’s contribution. For example, a 31.1% contributes 31.1 percentage points to the total deprivation score. It does not mean 31.1% of people are deprived of that indicator.
MP Index for the top 3 countries in Africa
Nigeria
The most recent survey data that were publicly available for Nigeria’s MPI estimation refer to 2021. Based on these estimates, 33.0 percent of the population in Nigeria (75,302 thousand people in 2023) is multidimensionally poor while an additional 16.6 percent is classified as vulnerable to multidimensional poverty (37,881 thousand people in 2023).
The intensity of deprivations in Nigeria, which is the average deprivation score among people living in multidimensional poverty, is 52.9 percent. The MPI value, which is the share of the population that is multidimensionally poor adjusted by the intensity of the deprivations, is 0.175.
READ ALSO: Nigeria’s 2020 Human Development Index
South Africa
The most recent survey data that were publicly available for South Africa’s MPI estimation refer to 2016. Based on these estimates, 6.3 percent of the population in South Africa (3,955 thousand people in 2023) is multidimensionally poor while an additional 12.2 percent is classified as vulnerable to multidimensional poverty (7,692 thousand people in 2023).
The intensity of deprivations in South Africa, which is the average deprivation score among people living in multidimensional poverty, is 39.8 percent. The MPI value, which is the share of the population that is multidimensionally poor adjusted by the intensity of the deprivations, is 0.025.
Egypt
The most recent survey data that were publicly available for Egypt’s MPI estimation refer to 2014. Based on these estimates, 5.2 percent of the population in Egypt (6,000 thousand people in 2023) is multidimensionally poor while an additional 6.1 percent is classified as vulnerable to multidimensional poverty (6,975 thousand people in 2023).
The intensity of deprivations in Egypt, which is the average deprivation score among people living in multidimensional poverty, is 37.6 percent. The MPI value, which is the share of the population that is multidimensionally poor adjusted by the intensity of the deprivations, is 0.020.
Source: 2025 Global MPI and MPI 2025 Country notes