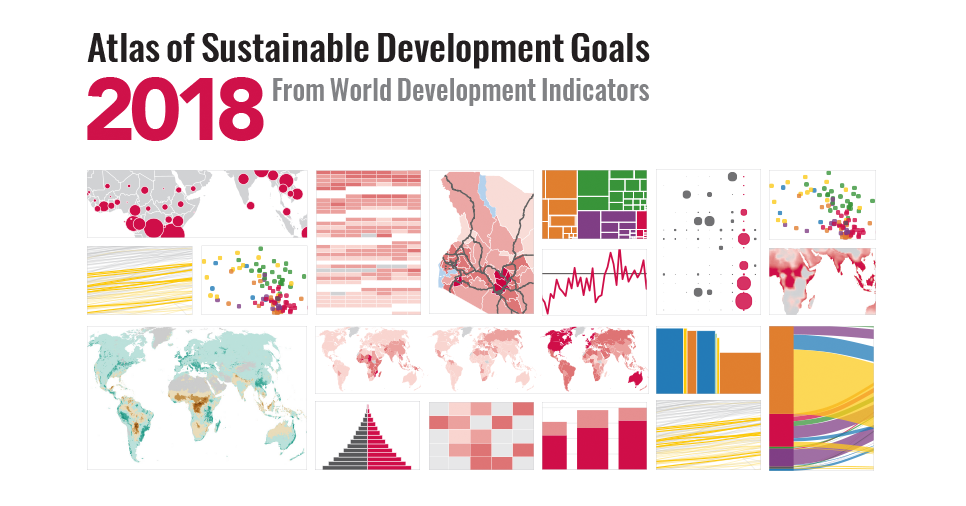
The World Bank recently released the 2018 Atlas of Sustainable Development Goals (SDGs). The atlas is an all-new visual guide to data and development about the SDGs! The Atlas includes more than 180 maps and charts that show progress societies are making towards the 17 SDGs.
The Atlas draws on World Development Indicators, a database of over 1,400 indicators for more than 220 economies, many going back over 50 years. Throughout the Atlas, data are presented by country, region, and income group and often disaggregated by sex, wealth, and geography. You can check the article about it and access the data behind the figures. You can also find the full atlas on World Bank’s site for all the SDGs.
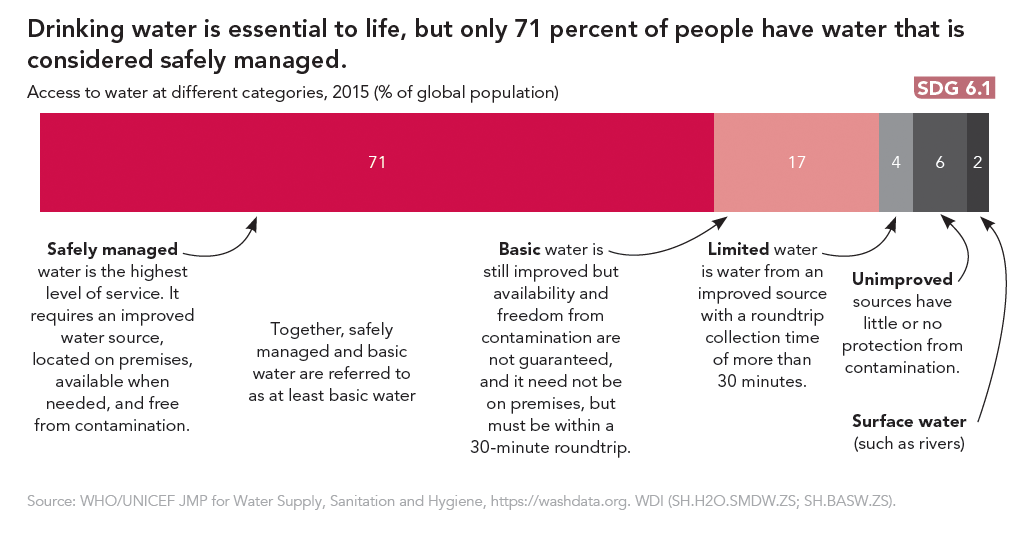
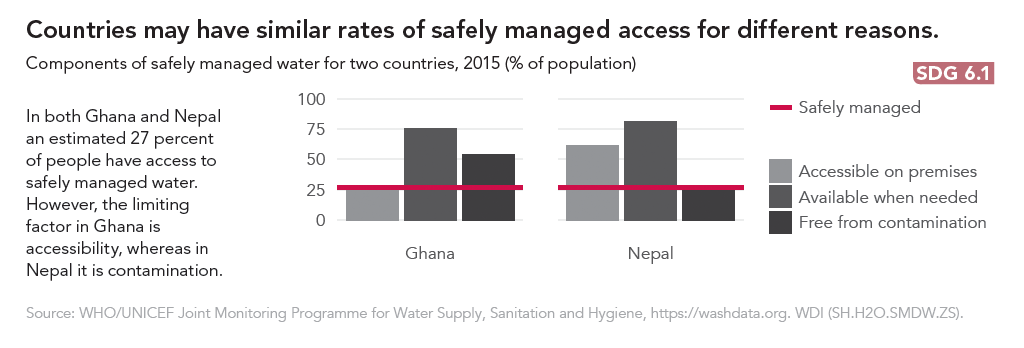
The maps for Sustainable Development Goal 6 are presented below.
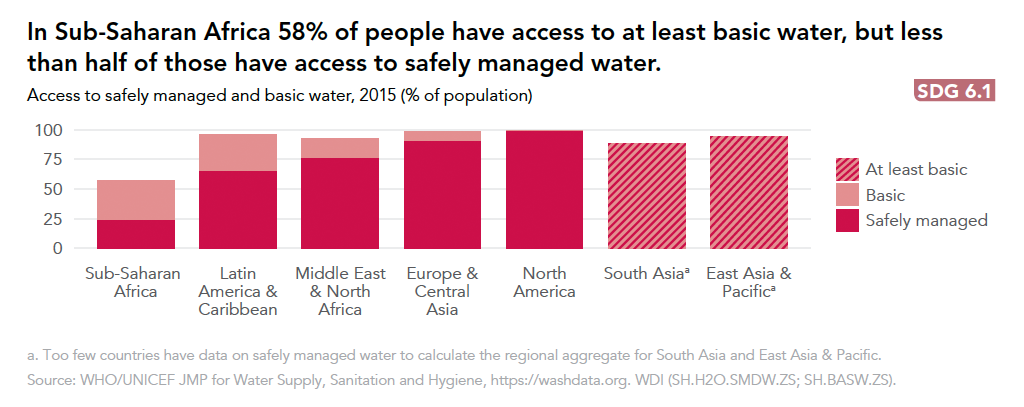
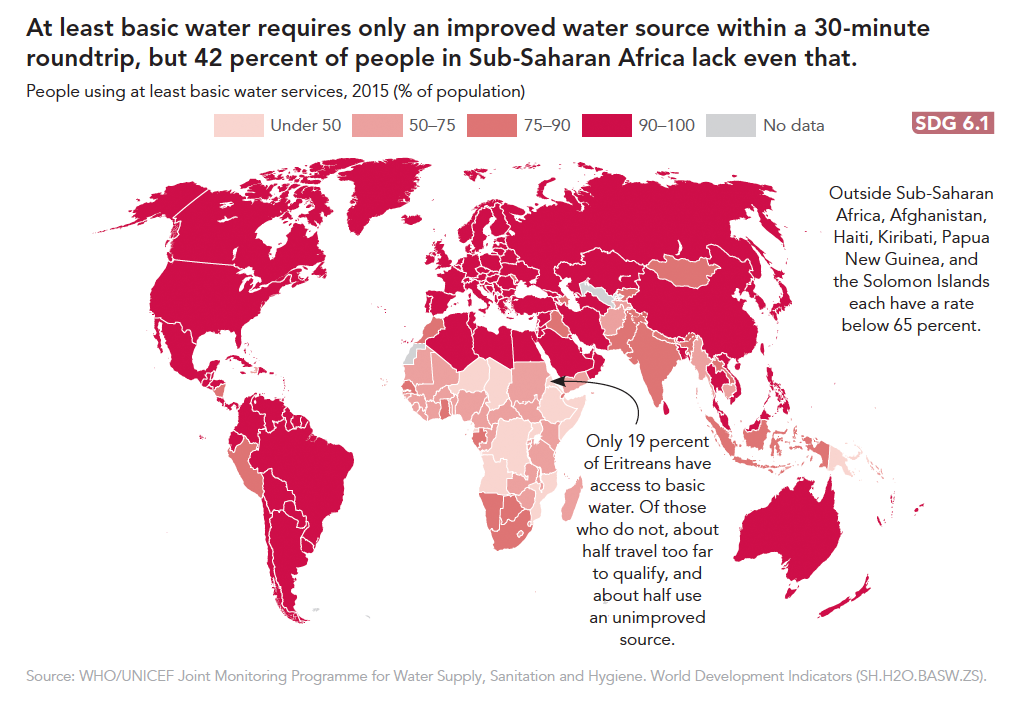
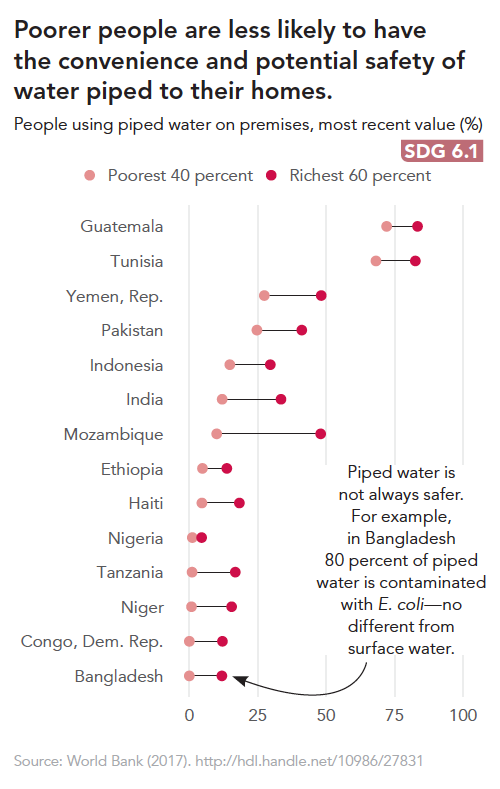
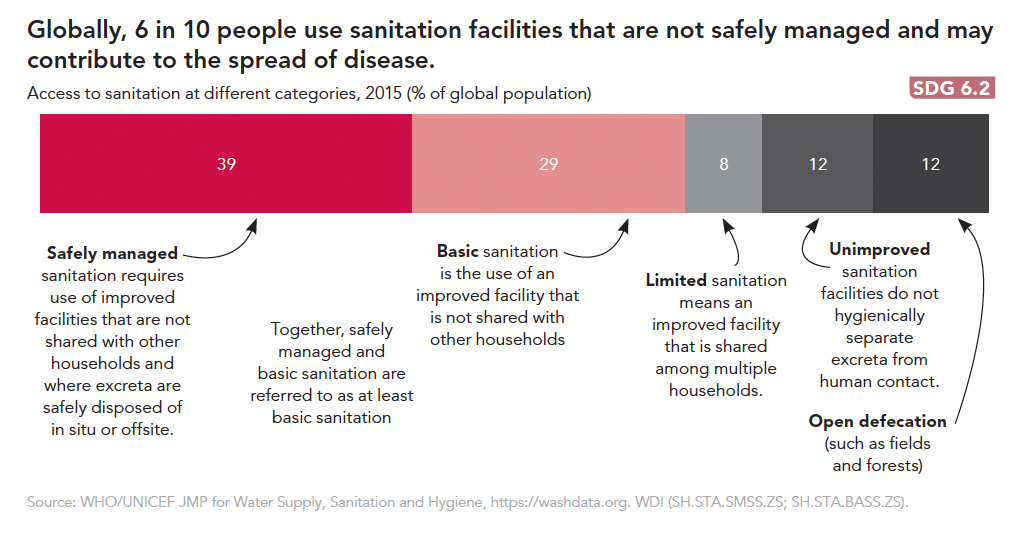
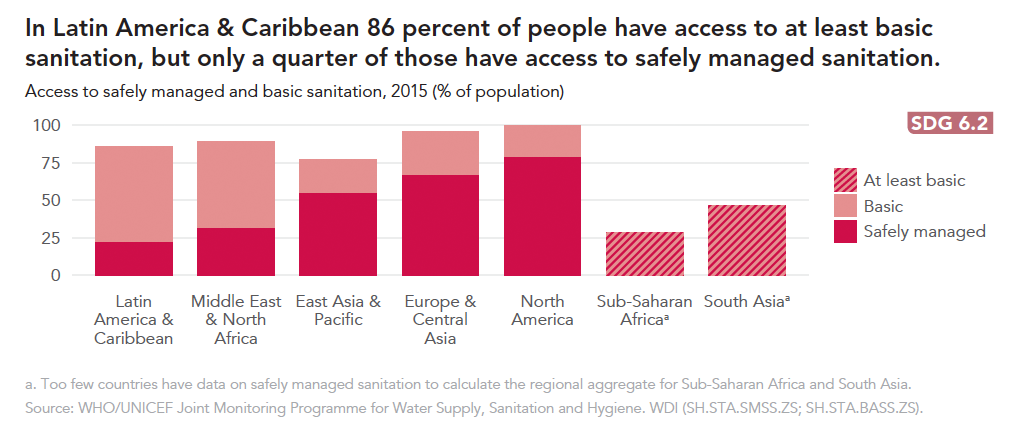
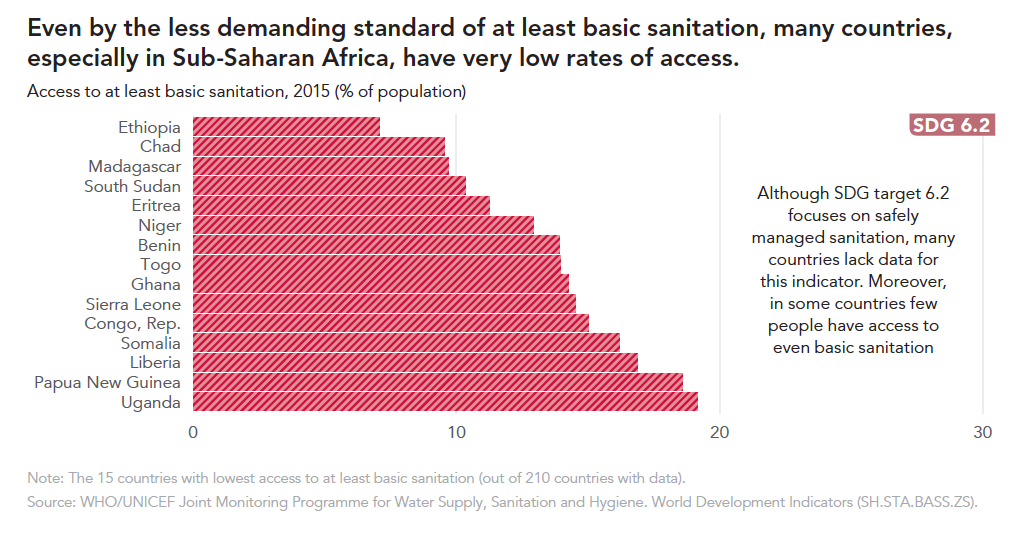
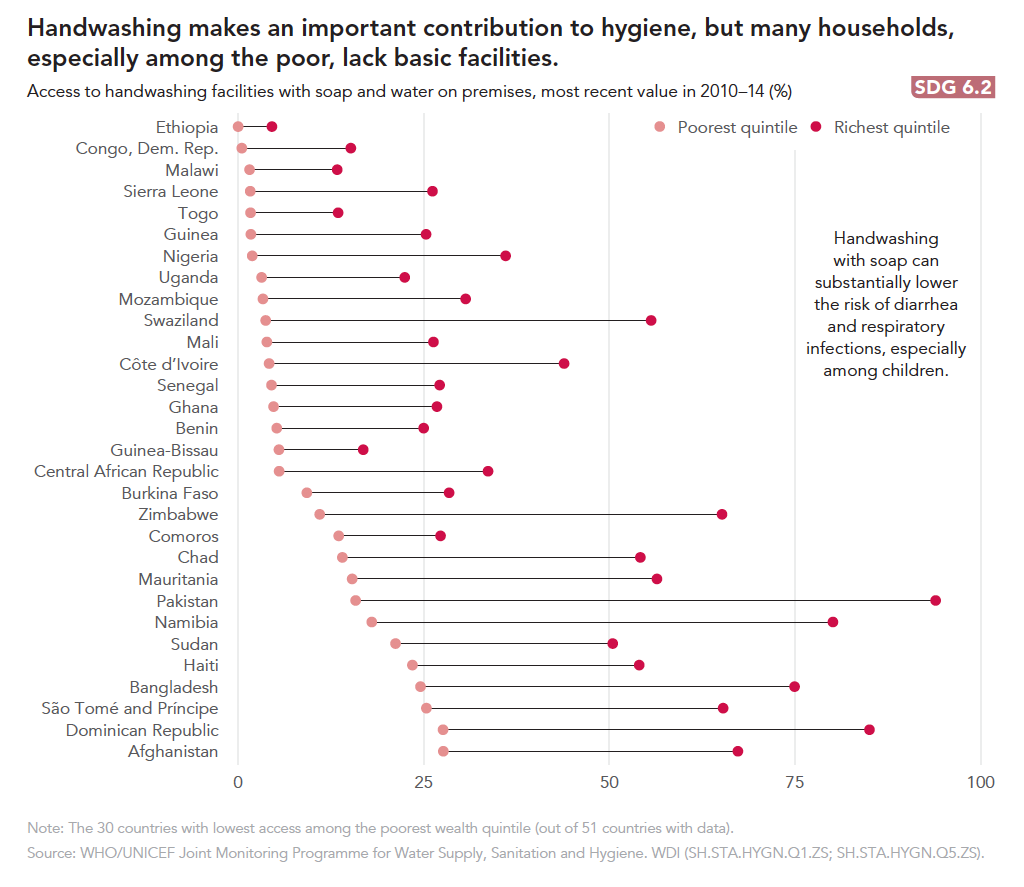
As someone who is passionate about Clean Water and Sanitation, I found out from the atlas that we still have a long way to go especially in Sub-Saharan Africa. Presently, things are looking up but more effort is needed if we truly want to ensure the availability and sustainable management of water and sanitation for all by 2030.